 KaamGenie
Select location▾
KaamGenie
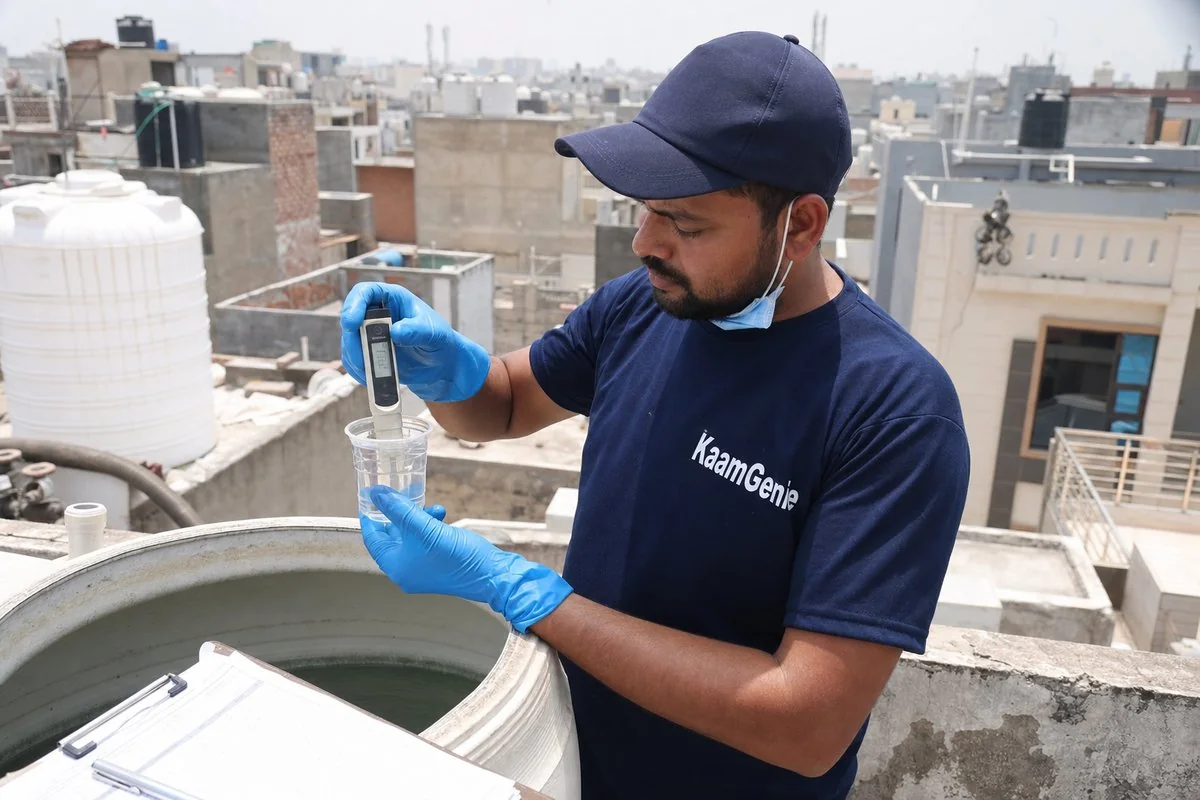
Delhi's water is measured at the treatment plant — but consumed from a rooftop tank. The Delhi Water Index is KaamGenie’s quarterly report on the water the city actually stores and drinks, combining field observations from tank-cleaning service visits across 250+ localities with public data from DJB, CGWB and BIS. Free to cite with attribution.
Delhi needs about 1,250 million gallons per day and produces roughly 961 MGD — a structural shortfall near 300 MGD, before counting the 52.35% lost in distribution. That gap is exactly why every Delhi roof carries storage: the tank is the city’s real last-mile water infrastructure, and its hygiene decides what families actually drink.
Sources: Delhi Economic Survey 2025–26; DJB production figures as reported by The Tribune (2026). “Reaches consumers” applies the reported 52.35% distribution-loss rate to production.
The single biggest driver of what we find inside a Delhi tank is where its water comes from. Piped DJB supply is treated and comparatively soft; private and society borewells pull hard, mineral-heavy groundwater that CGWB studies have repeatedly flagged for contamination. Indicative total-dissolved-solids (TDS) ranges we encounter, by zone:
Indicative ranges (mg/L) from KaamGenie field testing during service visits, consistent with CGWB district groundwater studies of South West Delhi. BIS IS 10500:2012 marks 500 mg/L as the acceptable limit and 2,000 mg/L as permissible in the absence of an alternative source.
Our crews open hundreds of tanks a month. The Tank Scale Index (0–100) summarises how much mineral scale and sediment we observe on a typical service visit in each zone — the higher the score, the faster tanks foul between cleans.
KaamGenie internal field index, Jan–Jun 2026 service visits. Observational rating of scale/sediment severity; not a laboratory water-quality measurement.
Tank-contamination risk in Delhi is seasonal and predictable: algae growth accelerates through the May–June heat, and the sharpest deterioration follows the monsoon, when runoff, sewer overflow and recharge push contaminants into groundwater and open tanks. Our service-callout mix tracks the same curve every year.
KaamGenie contamination-risk index (0–100) by month, from the seasonal mix of urgent-cleaning callouts, 2025–26. August–September is the post-monsoon peak — the single best time to have already cleaned your tank is June.
| Zone | Dominant source | Hardness band | Scale index | Suggested cleaning interval |
|---|---|---|---|---|
| New Delhi / Lutyens (NDMC) | NDMC piped | Soft–moderate | 31 | Every 12 months |
| South Delhi (piped core) | DJB piped | Moderate | 52 | Every 12 months |
| Dwarka sub-city | DJB + society borewells | Moderate–hard | 49 | Every 9–12 months |
| South East Delhi | DJB + borewell pockets | Moderate–hard | 58 | Every 9 months |
| North West Delhi | DJB (Haiderpur) + borewell | Hard | 63 | Every 9 months |
| West Delhi | DJB + borewell | Hard | 71 | Every 6–9 months |
| Outer West / UER belt | Borewell + tanker | Very hard | 78 | Every 6 months |
| South West borewell belt | Borewell | Very hard | 82 | Every 6 months |
Hardness bands are field characterisations relative to BIS IS 10500 limits (200 mg/L acceptable / 600 mg/L permissible as CaCO₃). Intervals are KaamGenie recommendations from observed fouling rates.
Type your locality or pincode and get its source, TDS band, scale index and cleaning advice — free.
The Index combines (a) qualitative and meter observations logged by KaamGenie crews during residential and society tank-cleaning visits across 250+ Delhi localities, Jan–Jun 2026, and (b) public data:
Field-index figures are observational and clearly labelled; they describe tank condition, not certified water-quality tests. Journalists and researchers: see our press & media page for a quotable spokesperson, seasonal briefings and zone-level data on request, or write to info@kaamgenie.com.
Source: The Delhi Water Index (Q3 2026), KaamGenie — https://kaamgenie.com/delhi-water-index
Overhead tank cleaning from ₹699, underground sumps ₹1,499 — same-day across Delhi if you call before 10 AM.
Call +91 95603 66362